The Scoop Dashboard provides the insights and control you need to measure, manage, and grow your commuter program all in one place.
The Overview tab contains Trip metrics, Commuter metrics, and Impact metrics. The metrics are updated every 48 hours and can be viewed weekly, monthly, quarterly, or yearly.
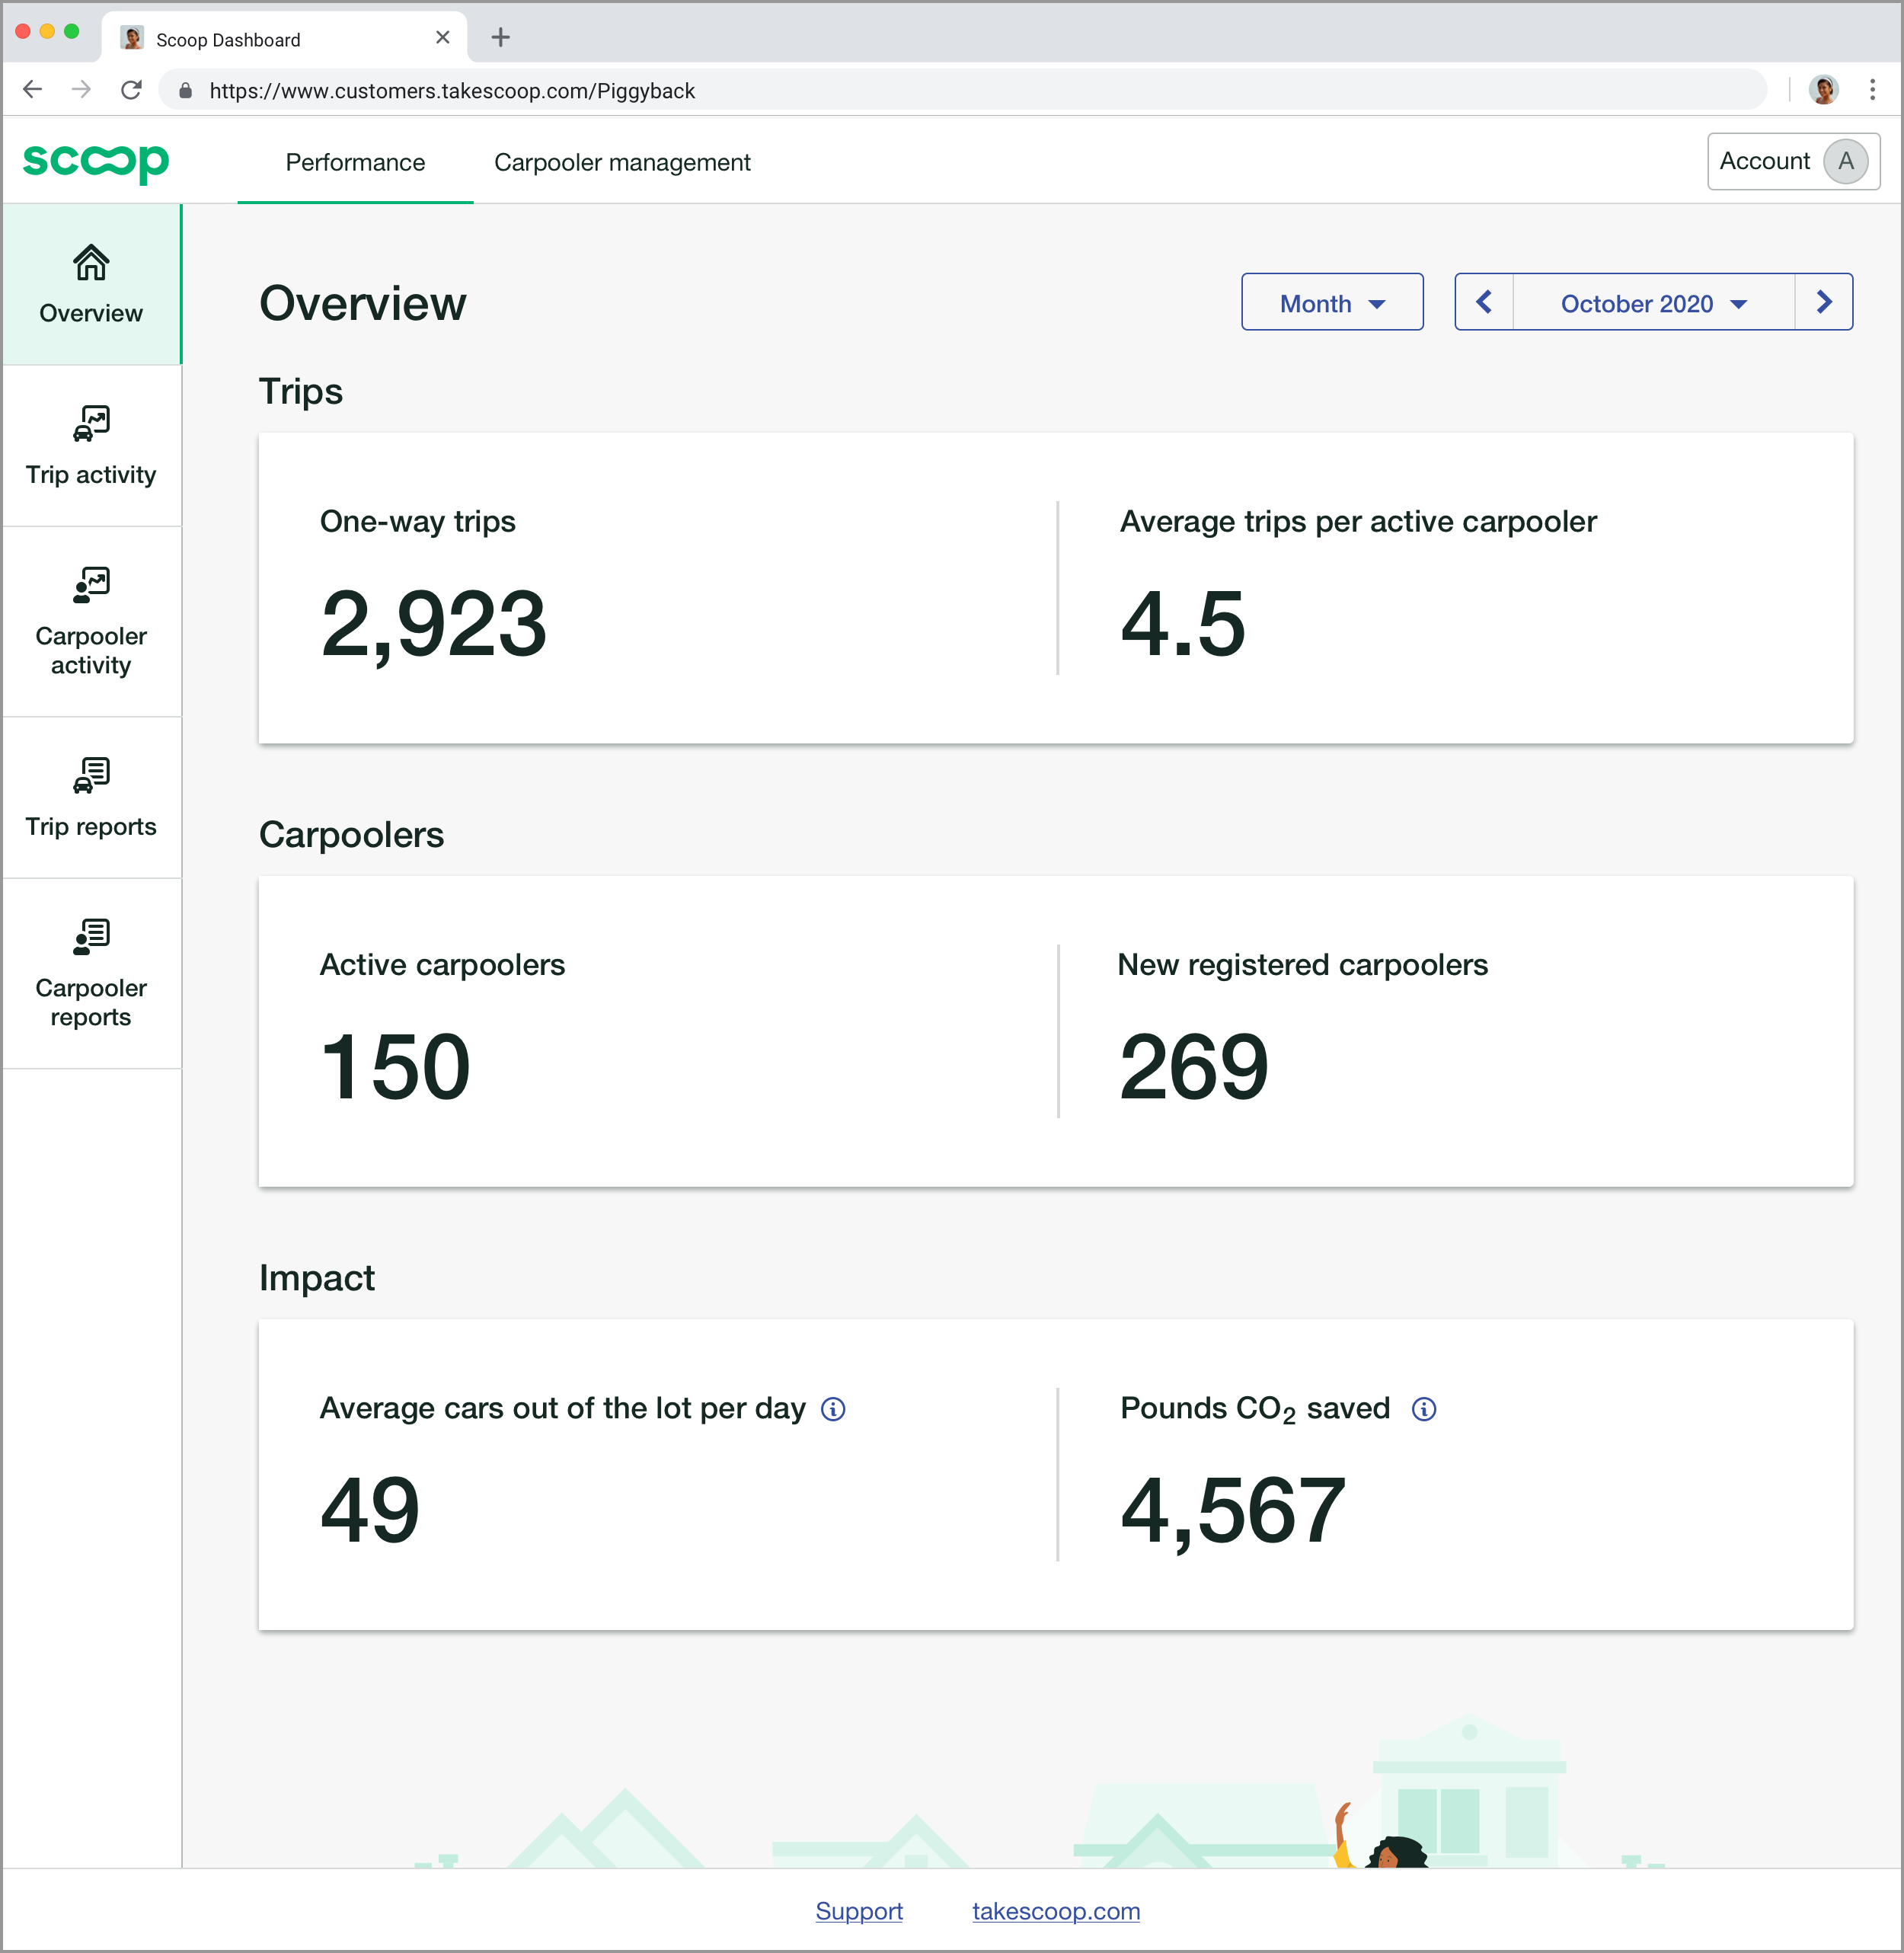
Trip metrics
One-way trips
Number of individual trips taken. Each carpooler can take up to two one-way trips per day.
Average trips per active carpooler
Average number of one-way trips divided by the number of active carpoolers in your program.
Carpooler metrics
Active carpoolers
Unique number of carpoolers who took a trip.
New registered carpoolers
Number of new users who have signed up for your program. This just counts users who have never been a member of your program. If a carpooler was deactivated then reactivated, for example, they wouldn’t be counted as a new registered user.
Impact metrics
Average cars out of the lot per day
Average number of Riders going to and from your site daily. Each Rider is counted only once and is assumed to free up one parking space. To better understand Scoop’s impact on your facilities, multiply this number by your local SOV rate.
Pounds of CO2 saved
Number of miles saved by Riders not driving to work multiplied by estimated C02 emissions per mile*.
*https://www.epa.gov/energy/greenhouse-gases-equivalencies-calculator-calculations-and-references
Comments
0 comments
Article is closed for comments.