Activity graphs allow you to dive deeper into commuter and trip activity for your Scoop program over various time ranges.
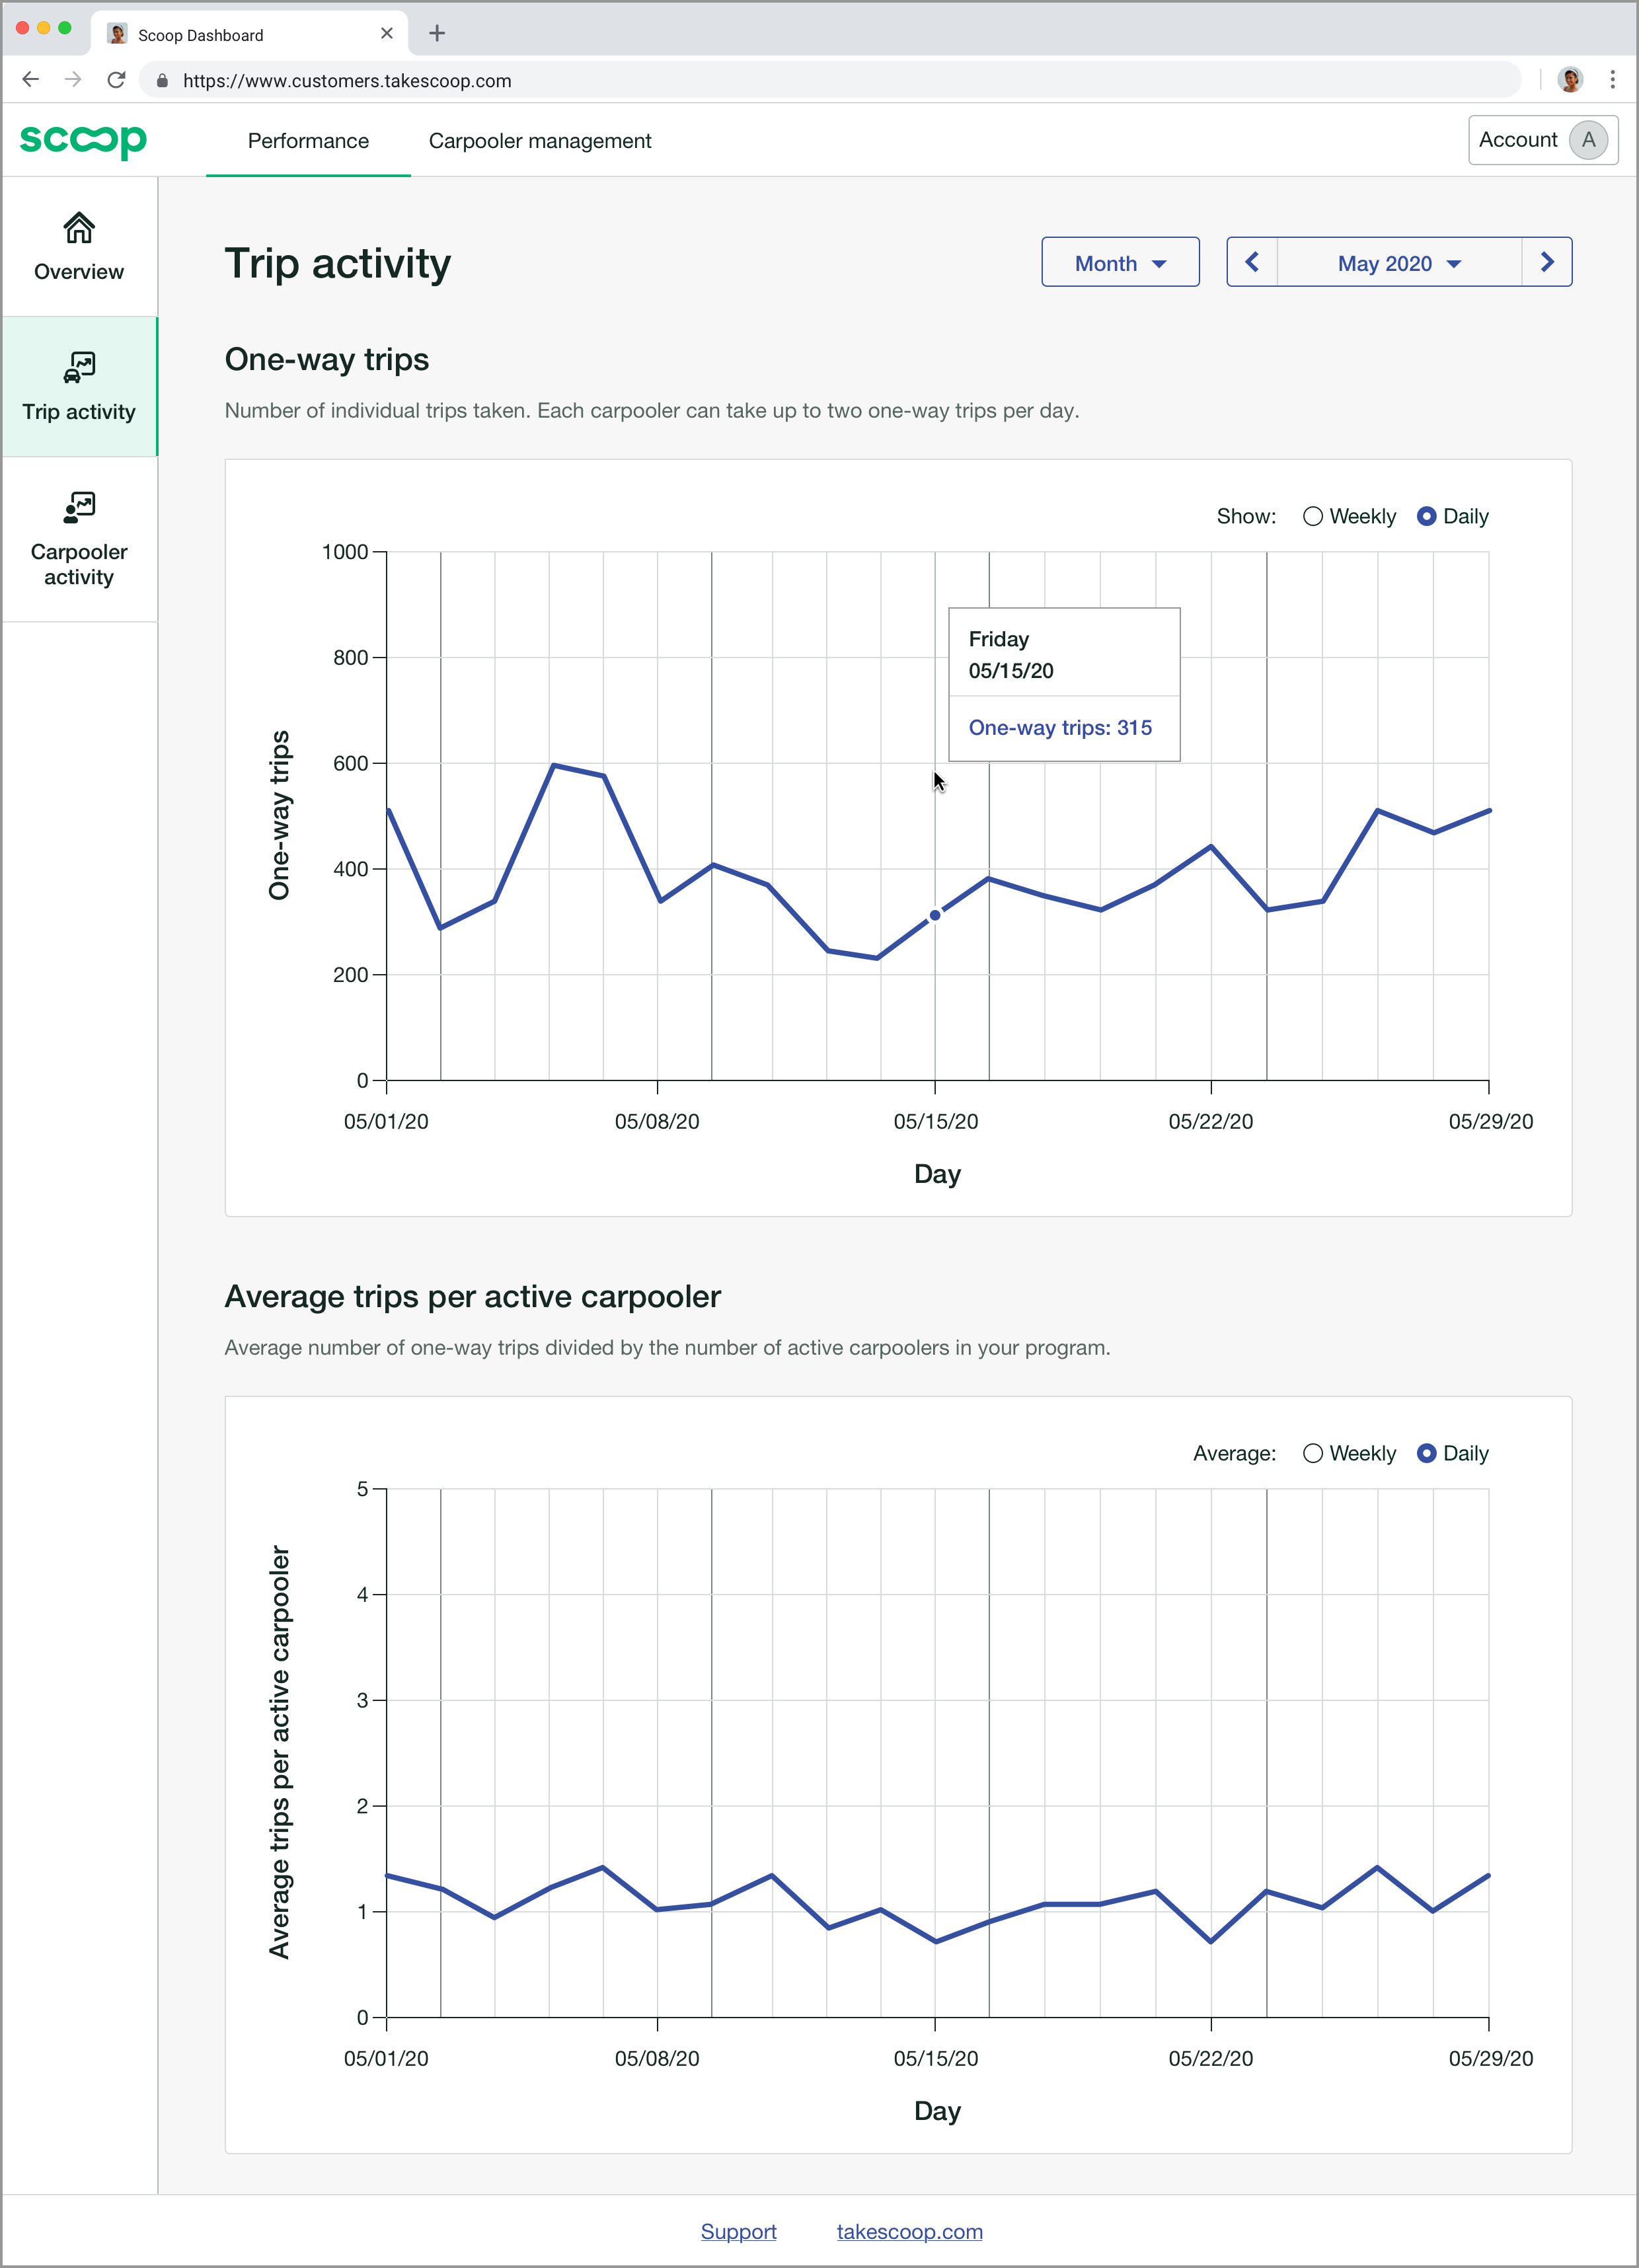
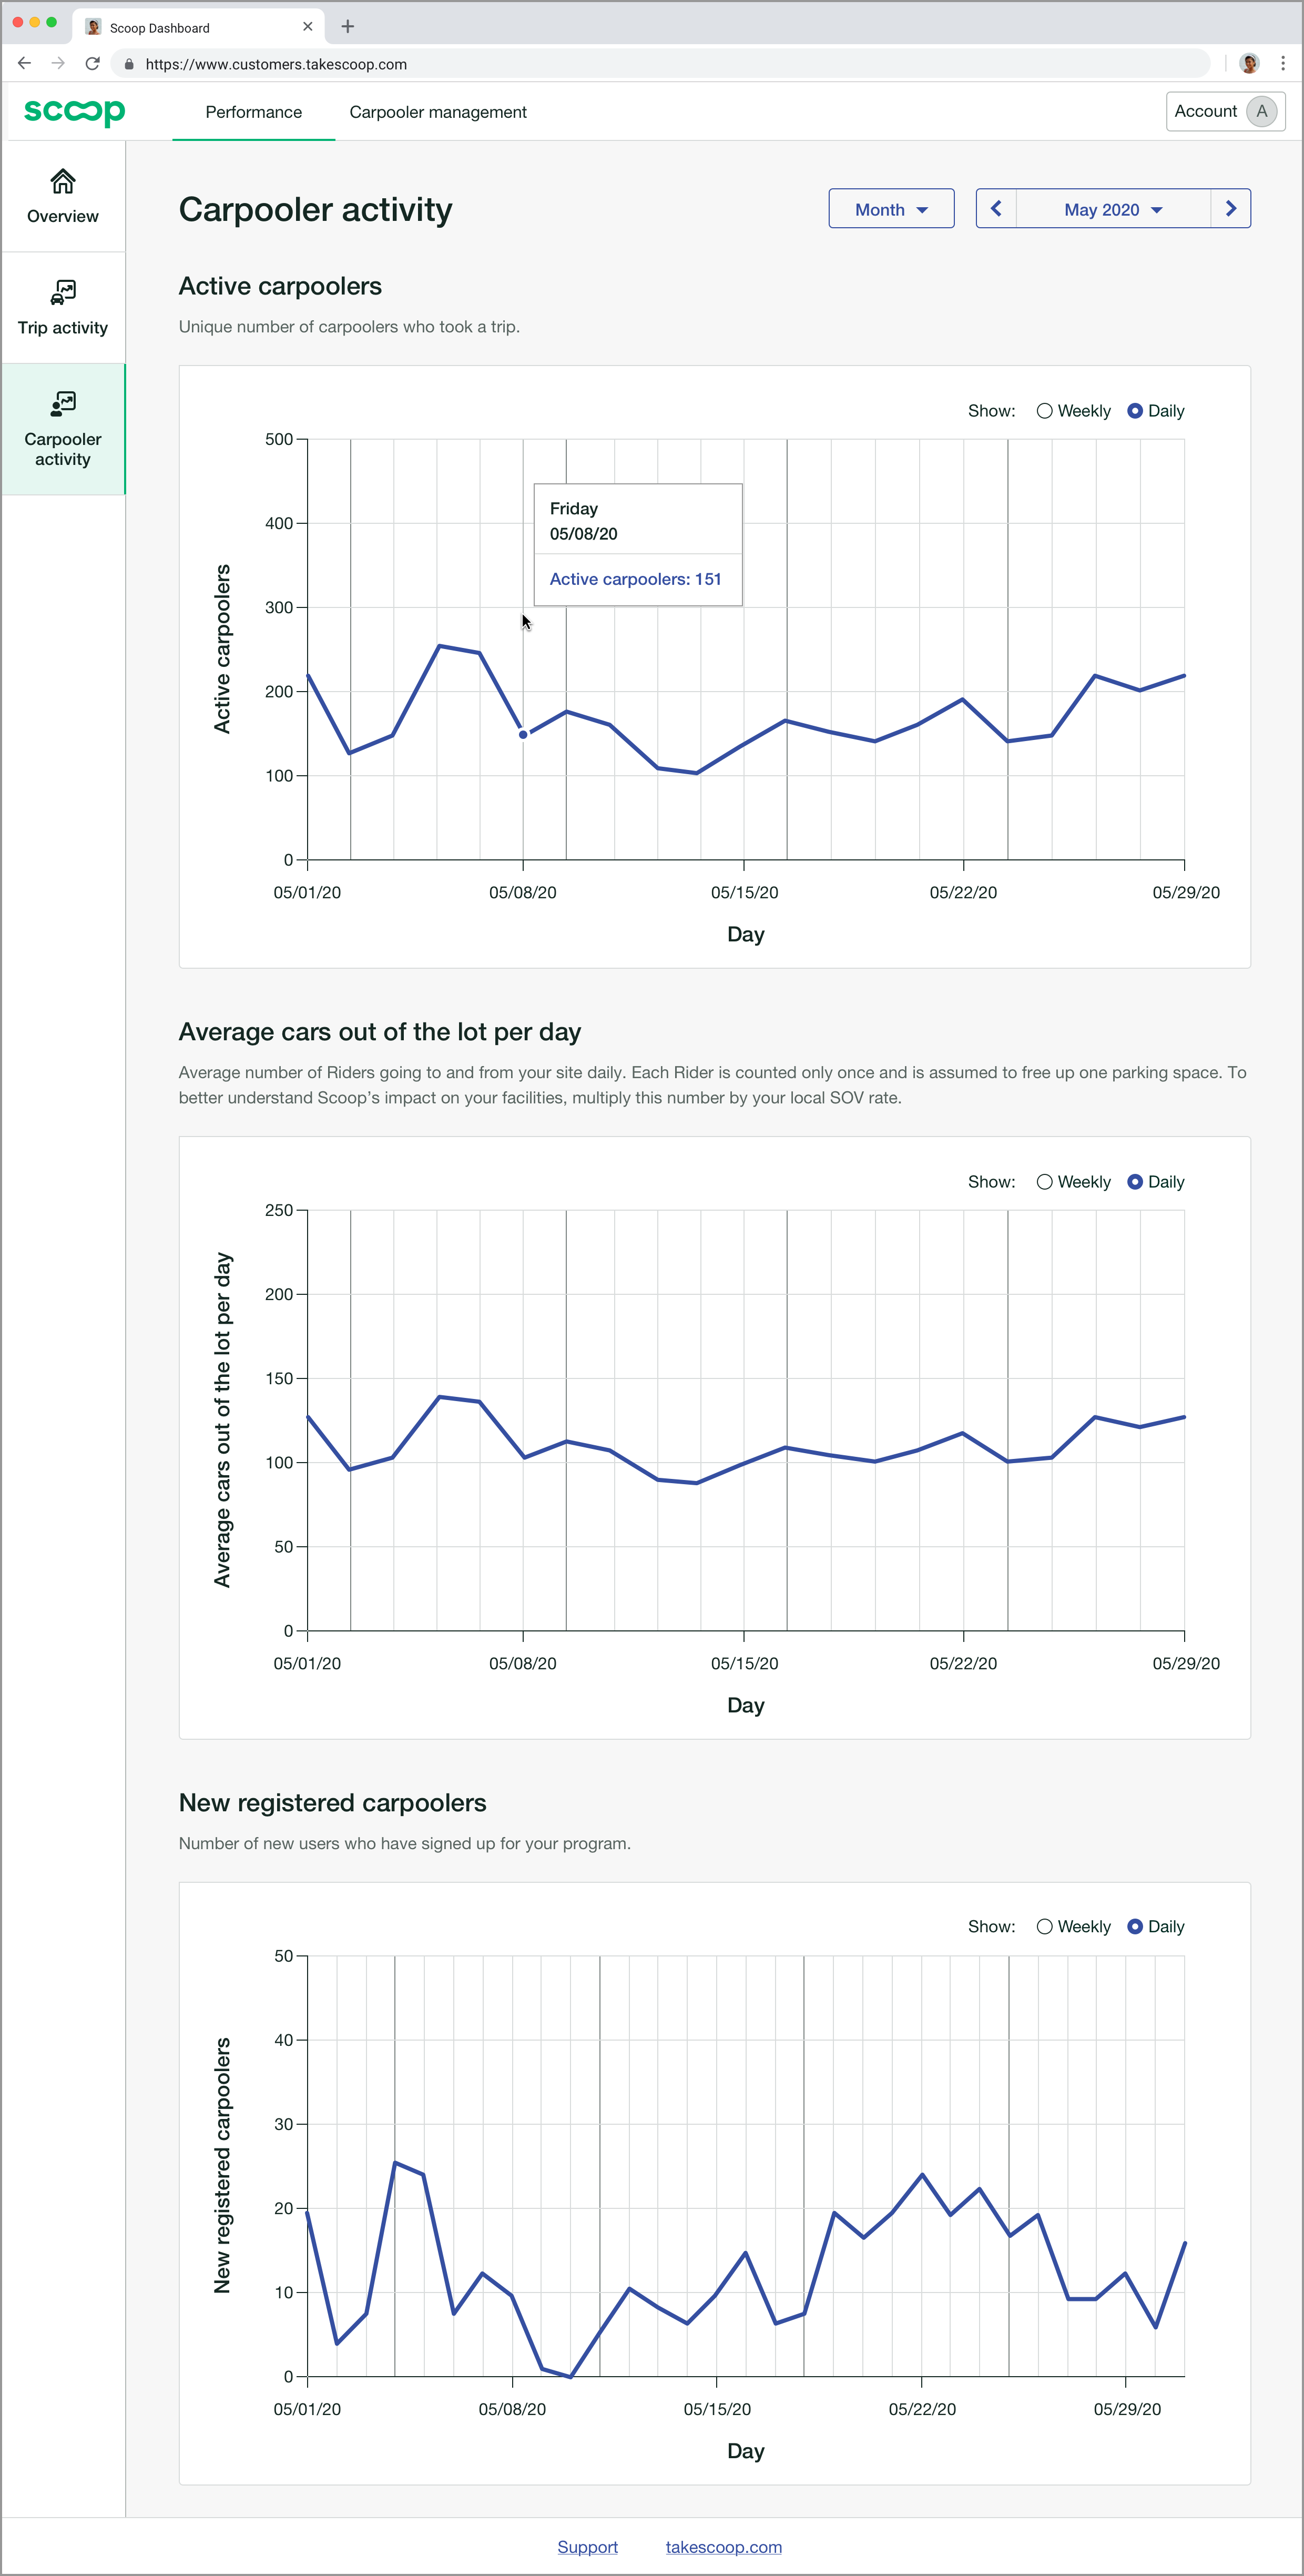
The metrics can be viewed by week, month, quarter, or year. When viewing the metrics at the month level, you can choose to display the data daily or weekly by selecting the granularity within each graph. We will display data up to the most recently completed day or week.
Hover over the graphs to reveal data points and their respective metric values.
To learn more about how we define each metric, see here.
Comments
0 comments
Article is closed for comments.